
The perfect terroir creates the most valuable real estate in the wine industry.
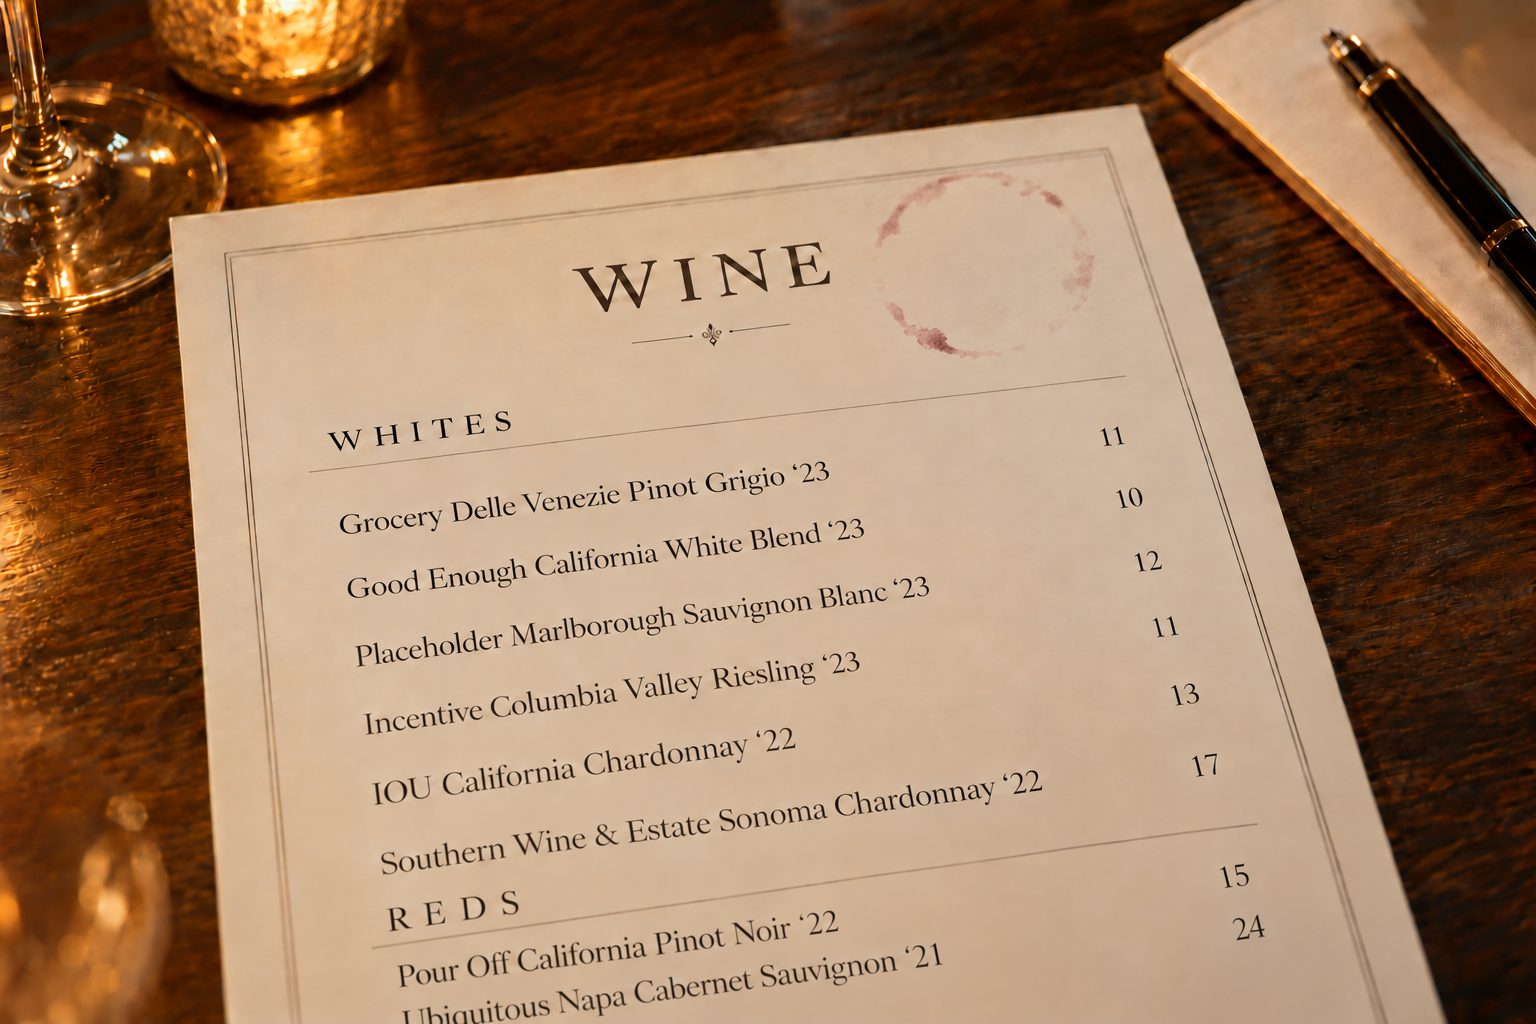
But if you’re a distributor, it’s the wine lists up and down the streets and boulevards of your territory.
Illustrative
National distributors have teams of software engineers and data analysts measuring and analyzing their on-premise visibility.
Now you have Liquid Equity — to measure your share of visibility on the wine lists in your territory, find the opportunities, and track your team’s progress against them.
Optimizing on-premise wine lists starts with intelligence.
Do you know how much of your real estate you own?
And do you know what it’s worth?

The opportunity
Do your reps know…
their share of visibility in their accounts, and across their territory?
their share of BTG — by varietal, by restaurant type?
their share of promotion — the features, the house wine?
which of their SKUs are vulnerable right now, and what to put in their place?
where they stand against incentives, against revenue goals, against PODs?
And do you know…
if your trade spend is being invested wisely?
whether you are over-delivering or under-delivering in the on-premise?
and what your biggest opportunities are?
We can help you and your team answer all of these questions, and much more.
Technology
The Visibility Cycle: from wine list to actionable insight.
The days of an administrator spending weeks putting together an error-prone spreadsheet to track on-premise BTG and BTB are over. Sales reps photograph the wine list — and any other visibility selling wine in the room: table tents, happy hour boards, BTG specials, half-off bottle specials — and upload it with the app. The AI-driven engine identifies the wines, matches them to the distributor, and creates analysis quickly and accurately. It gets smarter every time a new menu is scanned.
The list, as it was scanned

A real by-the-glass list. The cycle starts here, with one line.
Lifted off the page
Verbatim — including a vintage that reads 20223 and a stray space before a semicolon. Extraction records what is printed. It does not tidy, and it does not guess.
Data, and something to do about it
Six of the eleven whites on this list are Chardonnay. Three are Sauvignon Blanc. Two of those lines never printed a grape.
Fair share in this territory is 12%. Bars are drawn to a 0–30% scale.
You are winning Sauvignon Blanc and losing Chardonnay — and Chardonnay is on more lists in this territory than anything else you sell.
Understood, and matched to your book
Sauvignon Blanc appears nowhere on that line. Sancerre is Sauvignon Blanc by appellation law, so it resolves. Châteauneuf-du-Pape is a blend, so it does not — blends are kept whole rather than taken apart into grapes that were never printed.
Everything starts with accurately identifying the wine.
Share, opportunity, competition — none of it matters if the wine was read incorrectly. Identification is foundational.
- The scan is interpreted exactly as printed.→No corrections are made at this stage.
- Each wine is checked against our catalog and its known aliases.→A match is counted. Anything unmatched is set aside and identified, never guessed at.
- AI works inside our naming and matching rules.→Wine names are complicated, and the conventions change with where the wine comes from. Our rules account for that, so only the right name is identified and matched.
- Matched wines are attributed to the distributors that represent them.→Yours, or a named competitor.
- Validation runs at several levels.→Each scan is checked on its own, lists are checked against one another, and a second pass re-reads the evidence independently.
- A correction is made once.→When a wine is corrected, that correction is added to the foundation and applies to every scan that follows.
Accuracy at this stage is what makes everything after it worth acting on.
Solutions
Data beyond depletions, PODs and last buy.
A BTG feature is the most valuable real estate on a wine list. A POD without one is destined to be discontinued. None of those measures tells you which one you have.
Your system tells you
- How many cases sold, and when they last bought.
- That a POD exists at the account.
- A yes or a no. That is the whole of it.
Liquid Equity tells you
- Whether it is on the wine list — or was poured off on a Friday special and never appeared.
- Whether it went on by the glass, by the bottle, or both.
- Whether it is in their promotional platform — the feature, Wine Down Wednesday, the house pour.
- Where its price sits against the rest of that category on the list.
A new point of distribution pays the rep $100.
Depleted one case. It never reached the wine list — it only reached the chalkboard feature, once.
Depleted nine cases in 30 days — priced the BTG right, included in Wine Down Wednesday and Happy Hour.
Same POD. Same $100. Only one of them was worth paying for.
We track what’s important to you.
Illustrative
Competitive advantage
What is your specialty?
European? Italian? Napa? Argentina? Every house has one, and every house assumes it is winning there. A specialty is only an advantage if you can measure it.
Fair share is 12%. Bars are drawn to a 0–30% scale. Illustrative
The category a house calls its specialty is not always the one it is winning. Here the specialty runs two points over fair share, and a category nobody calls a specialty runs seven over.
Measure the category that’s important to you, so you can dominate the category that’s important to you.
Camera to boardroom
Thirty days is your entire market.
Reps scan on the call cycle they already work — no new route, no extra stop. Inside a month every list you sell to has been read, attributed and analyzed. You are not sampling the territory. You have all of it.
Every number states what it was counted from — how many accounts, in what period. A thin basis says so on its face.
ROI
Reward the sales drivers.
- Placement — on the list, not just on a chalkboard.
- Serve — by the glass, where the volume actually is.
- Promotion — in the feature you funded, rather than beside it.
- Price point — a price that maximizes brand equity and trial.
Distribution is not a sales driver, it’s the first gate.
Ownership
It is your data. We are the software.
Your accounts, your scans, your share — your data is just that, your data. Depletion data is never shared or aggregated for any other purpose.
Liquid Equity is not a data business that needs your accounts to have a product. The intelligence stays where it belongs.
Since 2019
This problem is older than the technology that solves it.
The work began in 2019, built on optical character recognition and machine learning, and it could not read a wine list well enough to be trusted. The vision waited for the technology to arrive. What finally made it possible is AI that reads a list the way someone in the trade reads it — not matching letter shapes, but understanding what a line on a menu actually says.
Reading it was never the hard part. An AI left to itself fills a gap with a confident guess, and a confident guess inside a share number is worse than no number at all. So the engine works under rules:
- It records what is printed.Nothing is tidied on the way in — a misprint is captured as a misprint.
- A blend stays a blend.Chianti is Chianti. It is never taken apart into grapes the list never printed.
- Nothing changes without a record.Corrections are flagged and logged. A person settles anything the engine has not seen before — once. After that the engine applies the decision itself, and the same question never comes back.
- We show our math.Every percentage comes with what it was counted from — 19% share, from 38 lists read in 30 days.
Built by someone who spent thirty years inside this business, on both the supplier and the distributor side — Gallo, AB InBev, Diageo, The Wine Group — not by a software company that recently discovered the three-tier system.
Coming soon
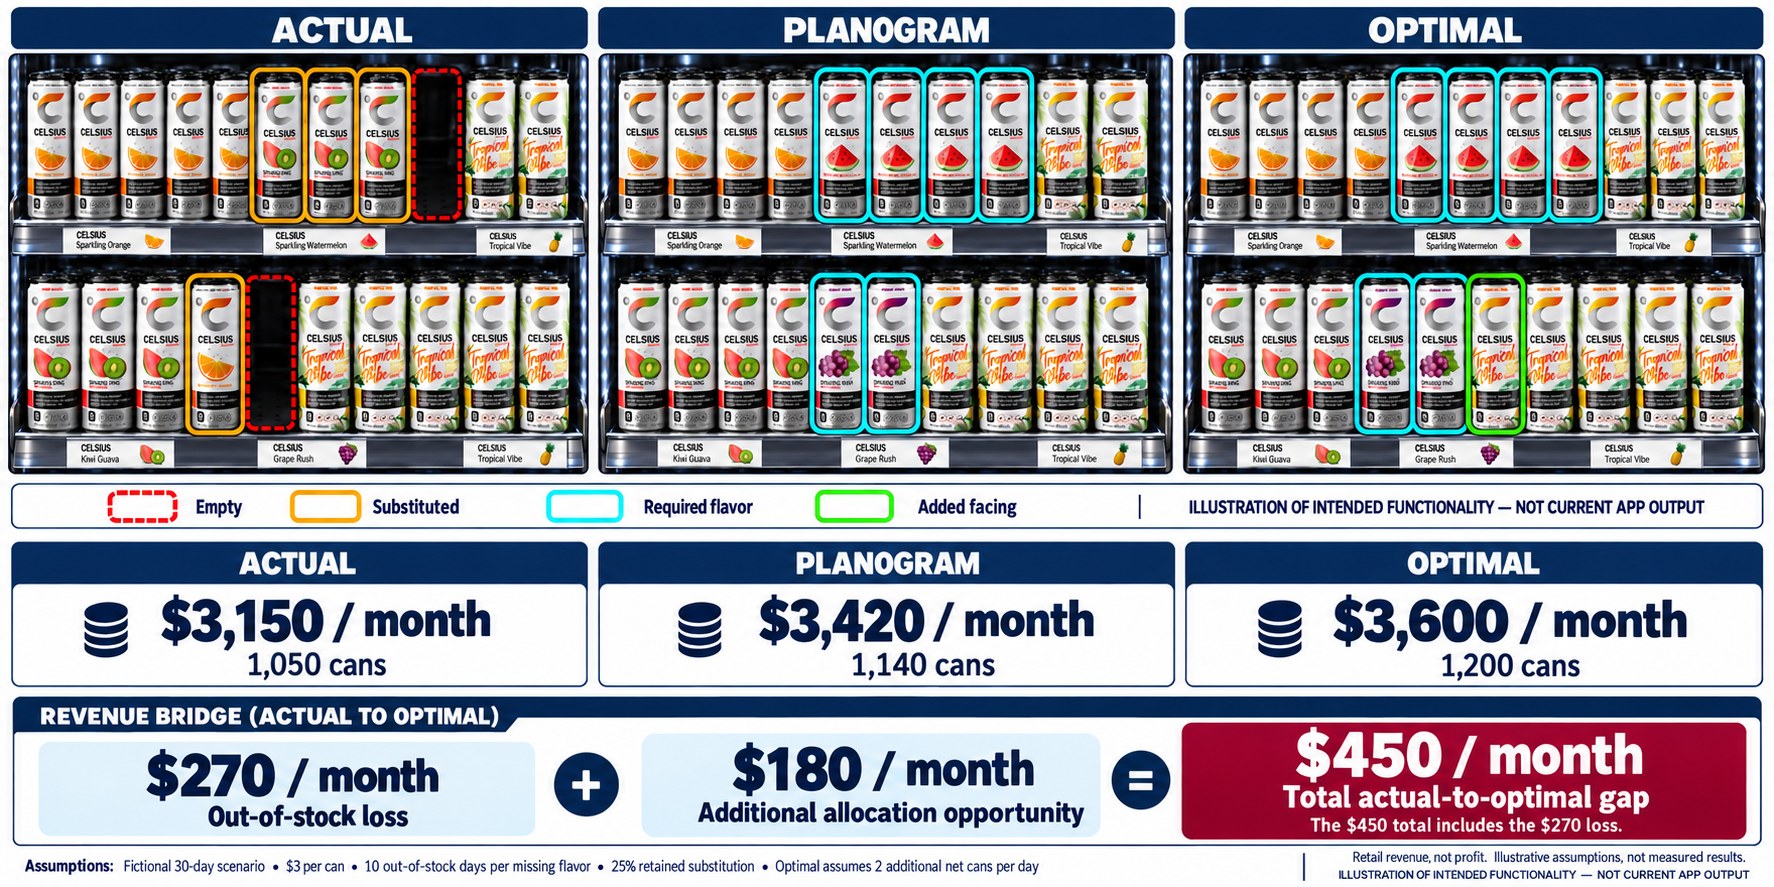
Energy drinks, and the most contested shelf in the store.
Schematics tell you what you should have in the cold box. Liquid Equity tells you what you actually have — and how to optimize that space.
Visibility is visibility, whether it is in the glass or the can.
The ask
Seventy-five to a hundred accounts. Scan, then rescan.
Pick the accounts. Your reps photograph the list on the call cycle they already work — about two minutes a stop, no new route. We read all of them, then read them again about thirty days later on the next pass. The rescan is the point: it proves the whole flow holds at volume, and it shows exactly what changed on those lists and what did not.
What we need to start
- Your book — the brand and SKU list for the market, however it exports.
- The accounts in scope, with addresses.
- Which rep covers which account.
- The programs running in those accounts — features, by the glass, house pours.
- Your depletions for those accounts. Visibility on its own is a map. Set against depletions, it answers whether being on the list moves the volume.
- Total on-premise brand depletions for the market — for modeling and scenario planning.
What you get back
- After the first pass: coverage, your share by account, by rep and by varietal, and whether the programs you funded are actually on the list.
- After the rescan: what changed on each list, what held, and where your share moved in between.